Using Explores in Lightdash
An Explore is the main starting point for exploring data in Lightdash. An Explore contains a group of related dbt models, dimensions, and metrics.
Watch this quick 2 minute tutorial where we talk through the key components of the Explore view:
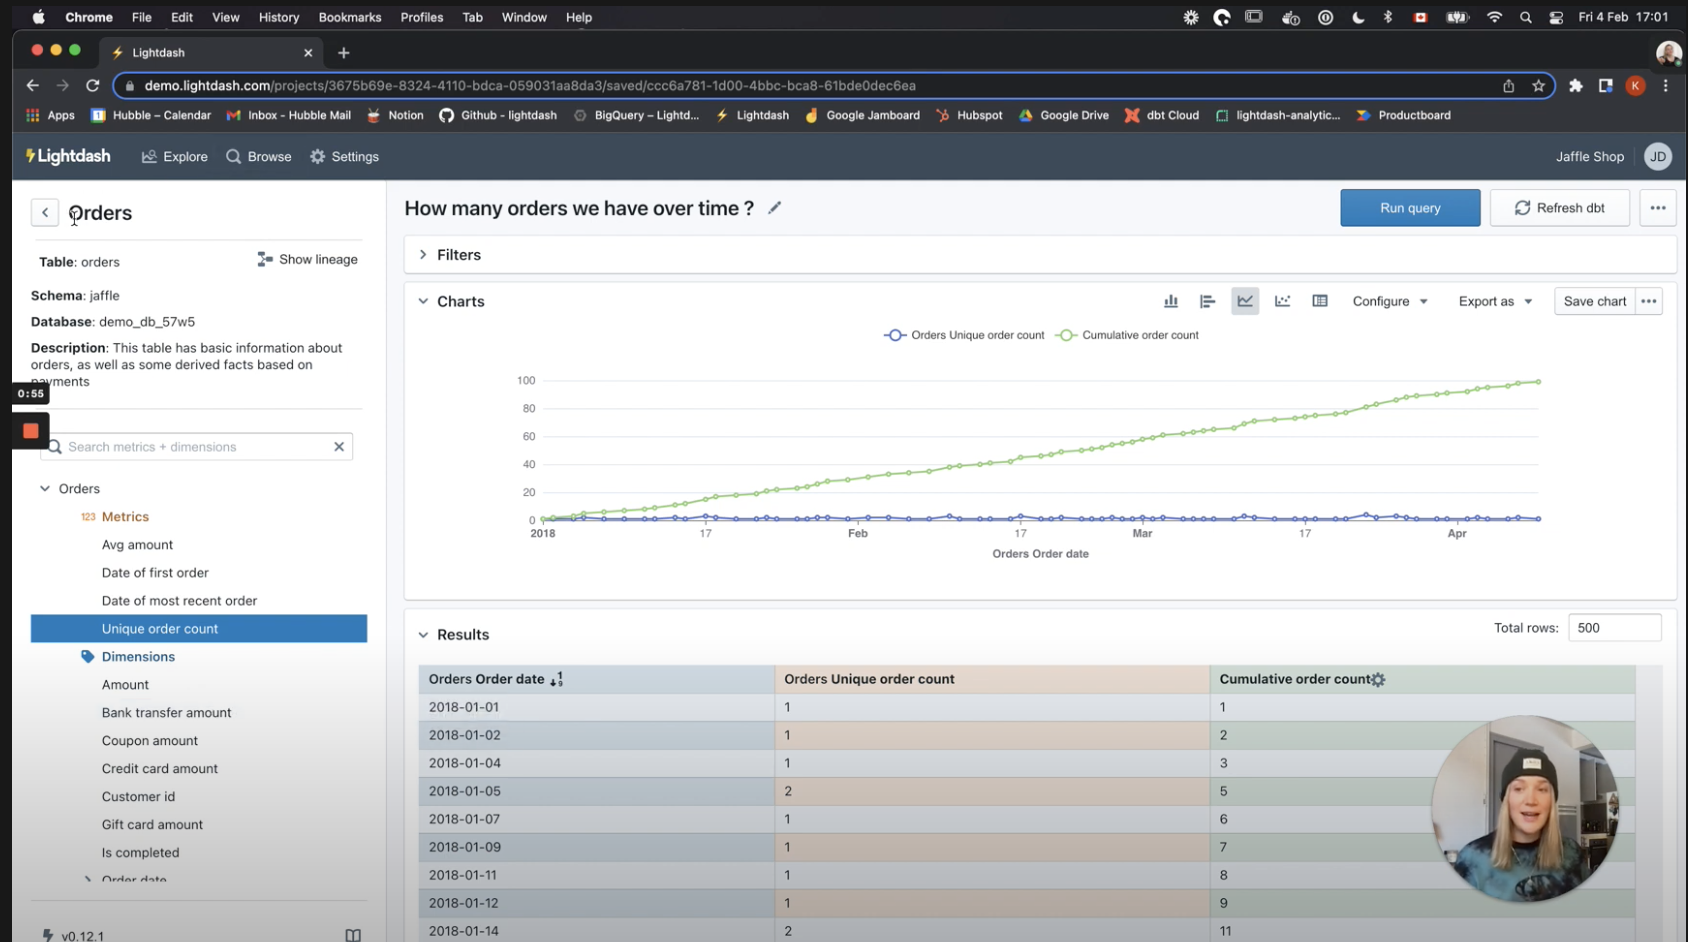
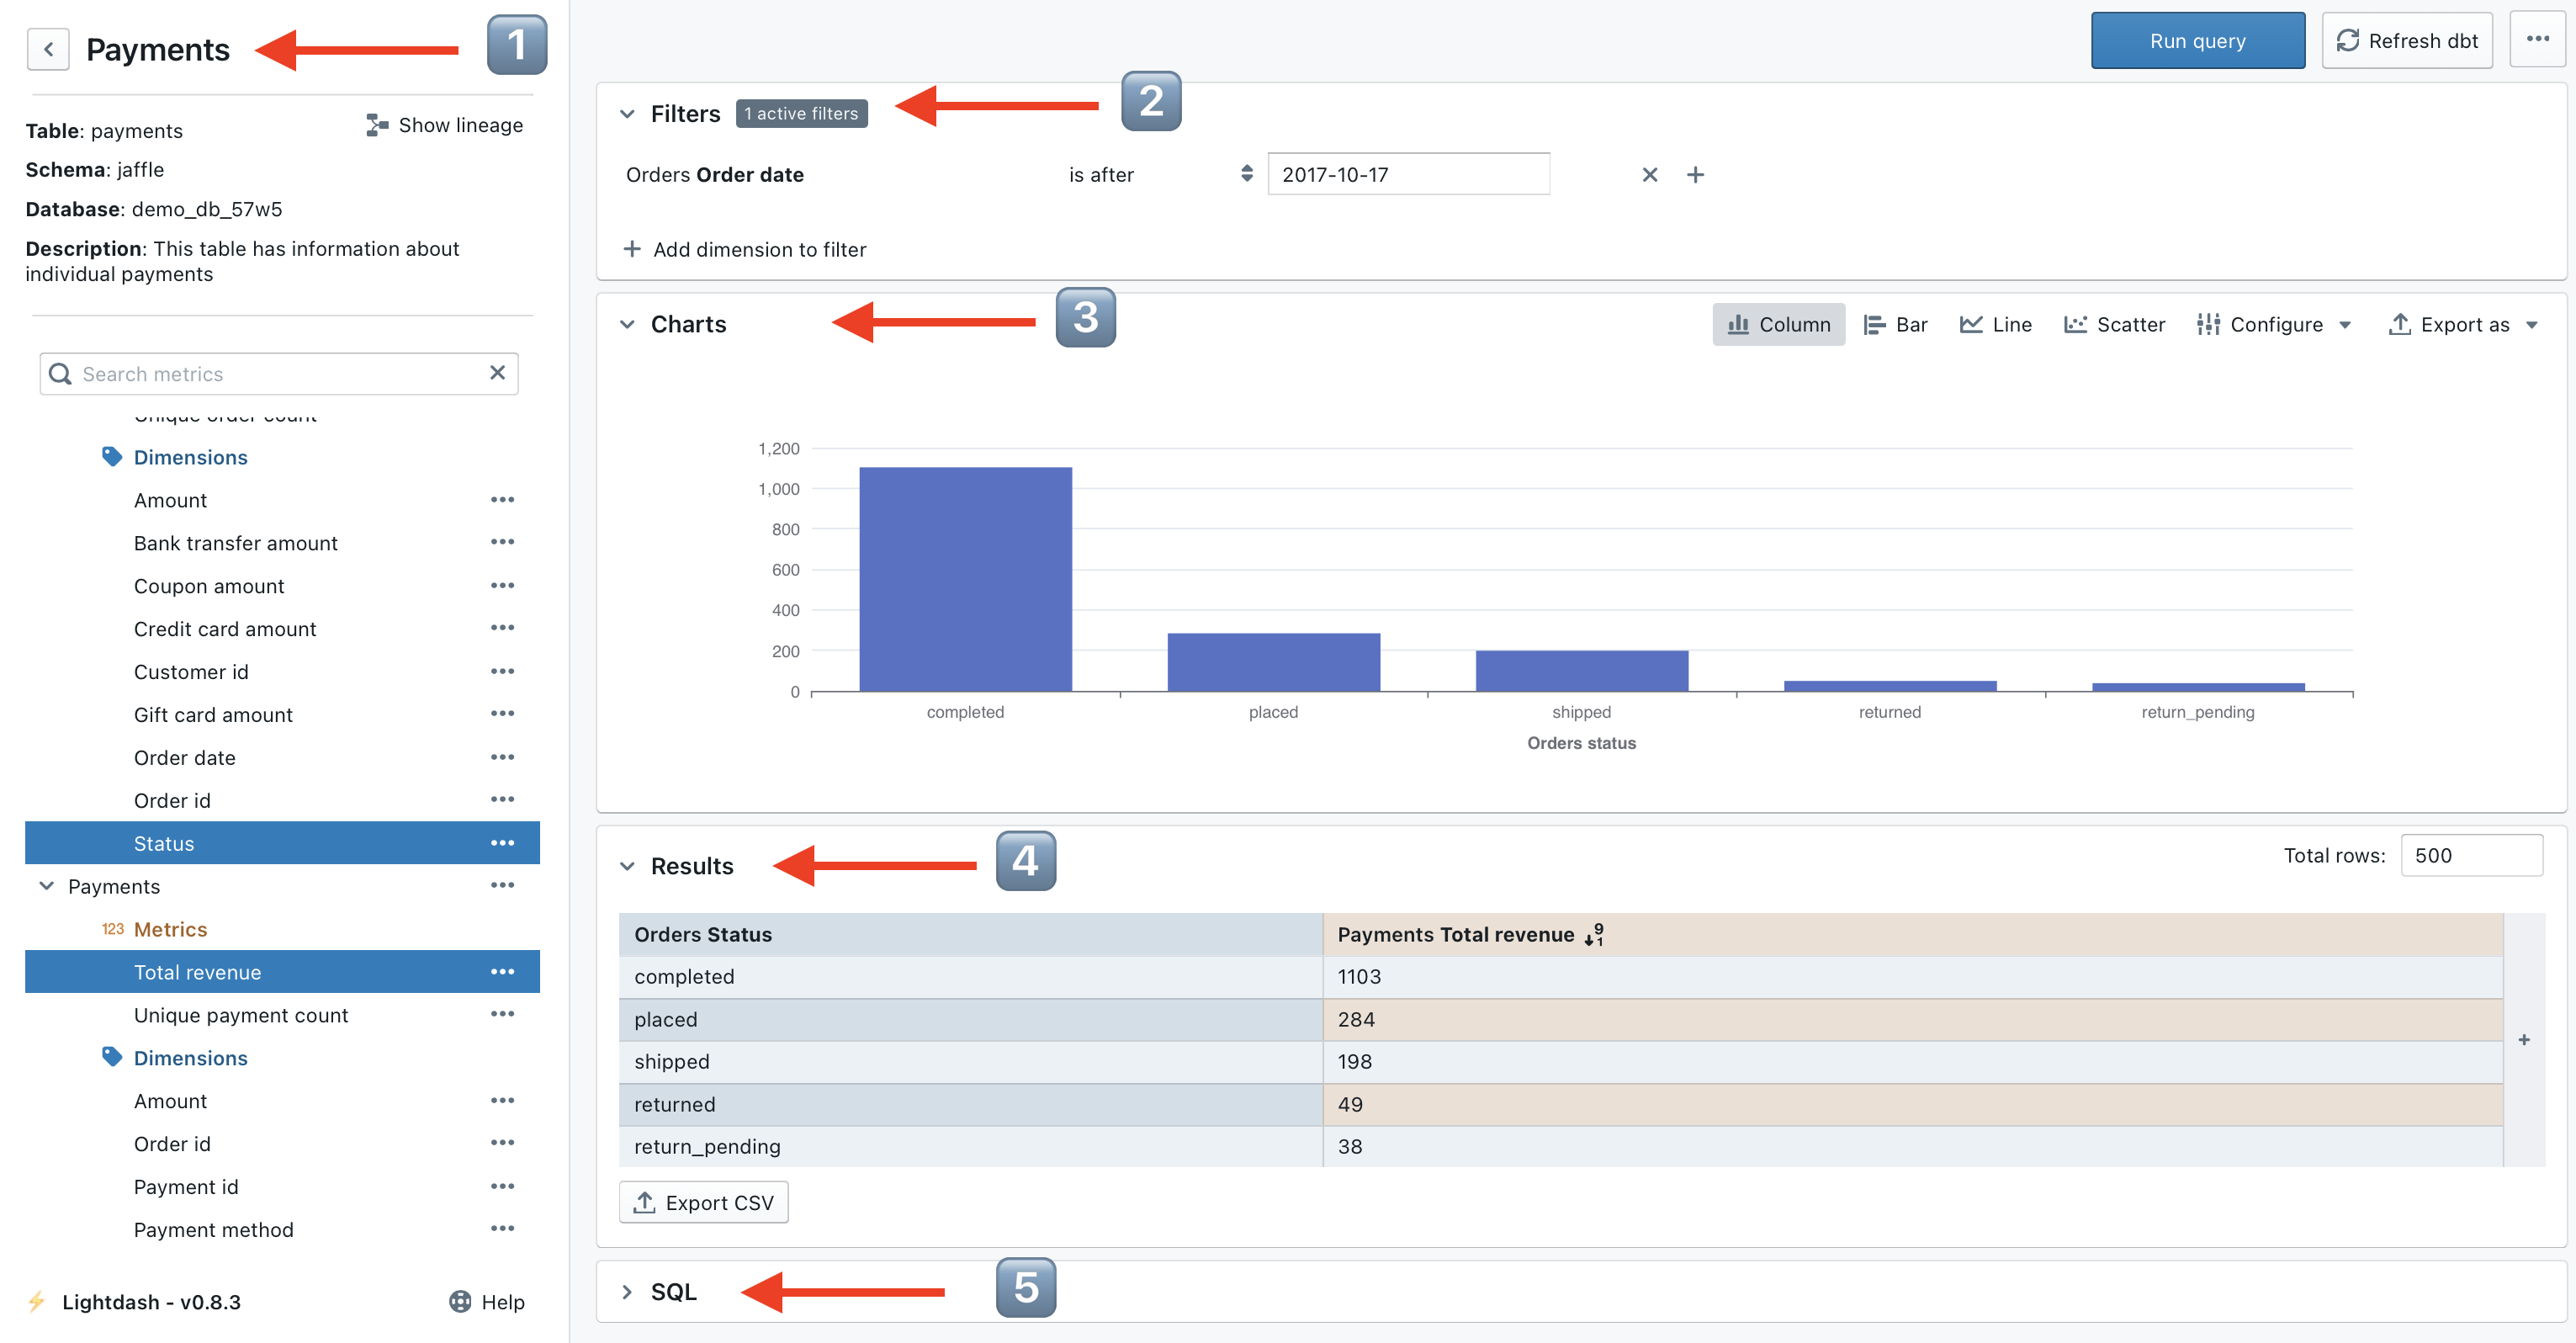
There are 5 areas to the Explore view:
- The list of metrics and dimensions available on the Explore
- The filters panel, which lets you restrict the data pulled into Lightdash
- The chart panel to visualise the results of queries
- The results panel to explore the results of queries as a table
- The SQL panel, which shows the raw SQL that produced the results
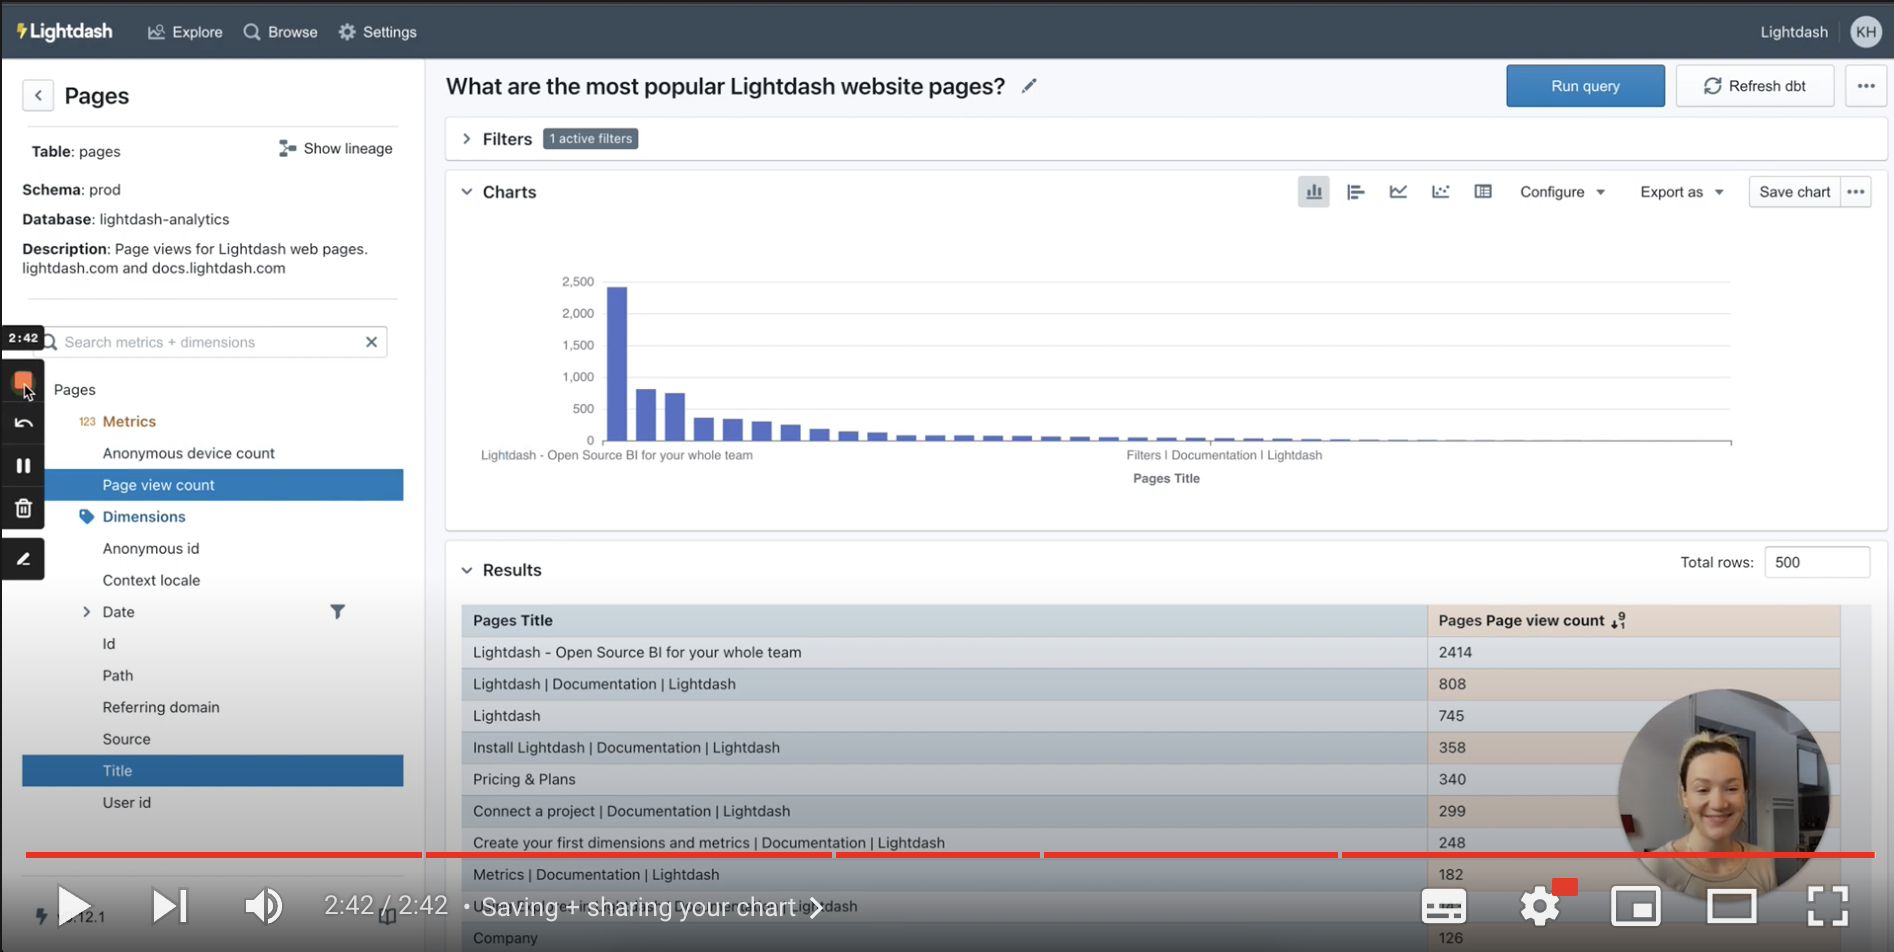
Learn how to create your first saved chart from the Explore view
Not a fan of videos? You can follow along with the steps below.
Running your first query
To run a query:
- Select a metric to calculate
- Select one or more dimensions to split the metric into groups
- Hit "Run Query" in the top right
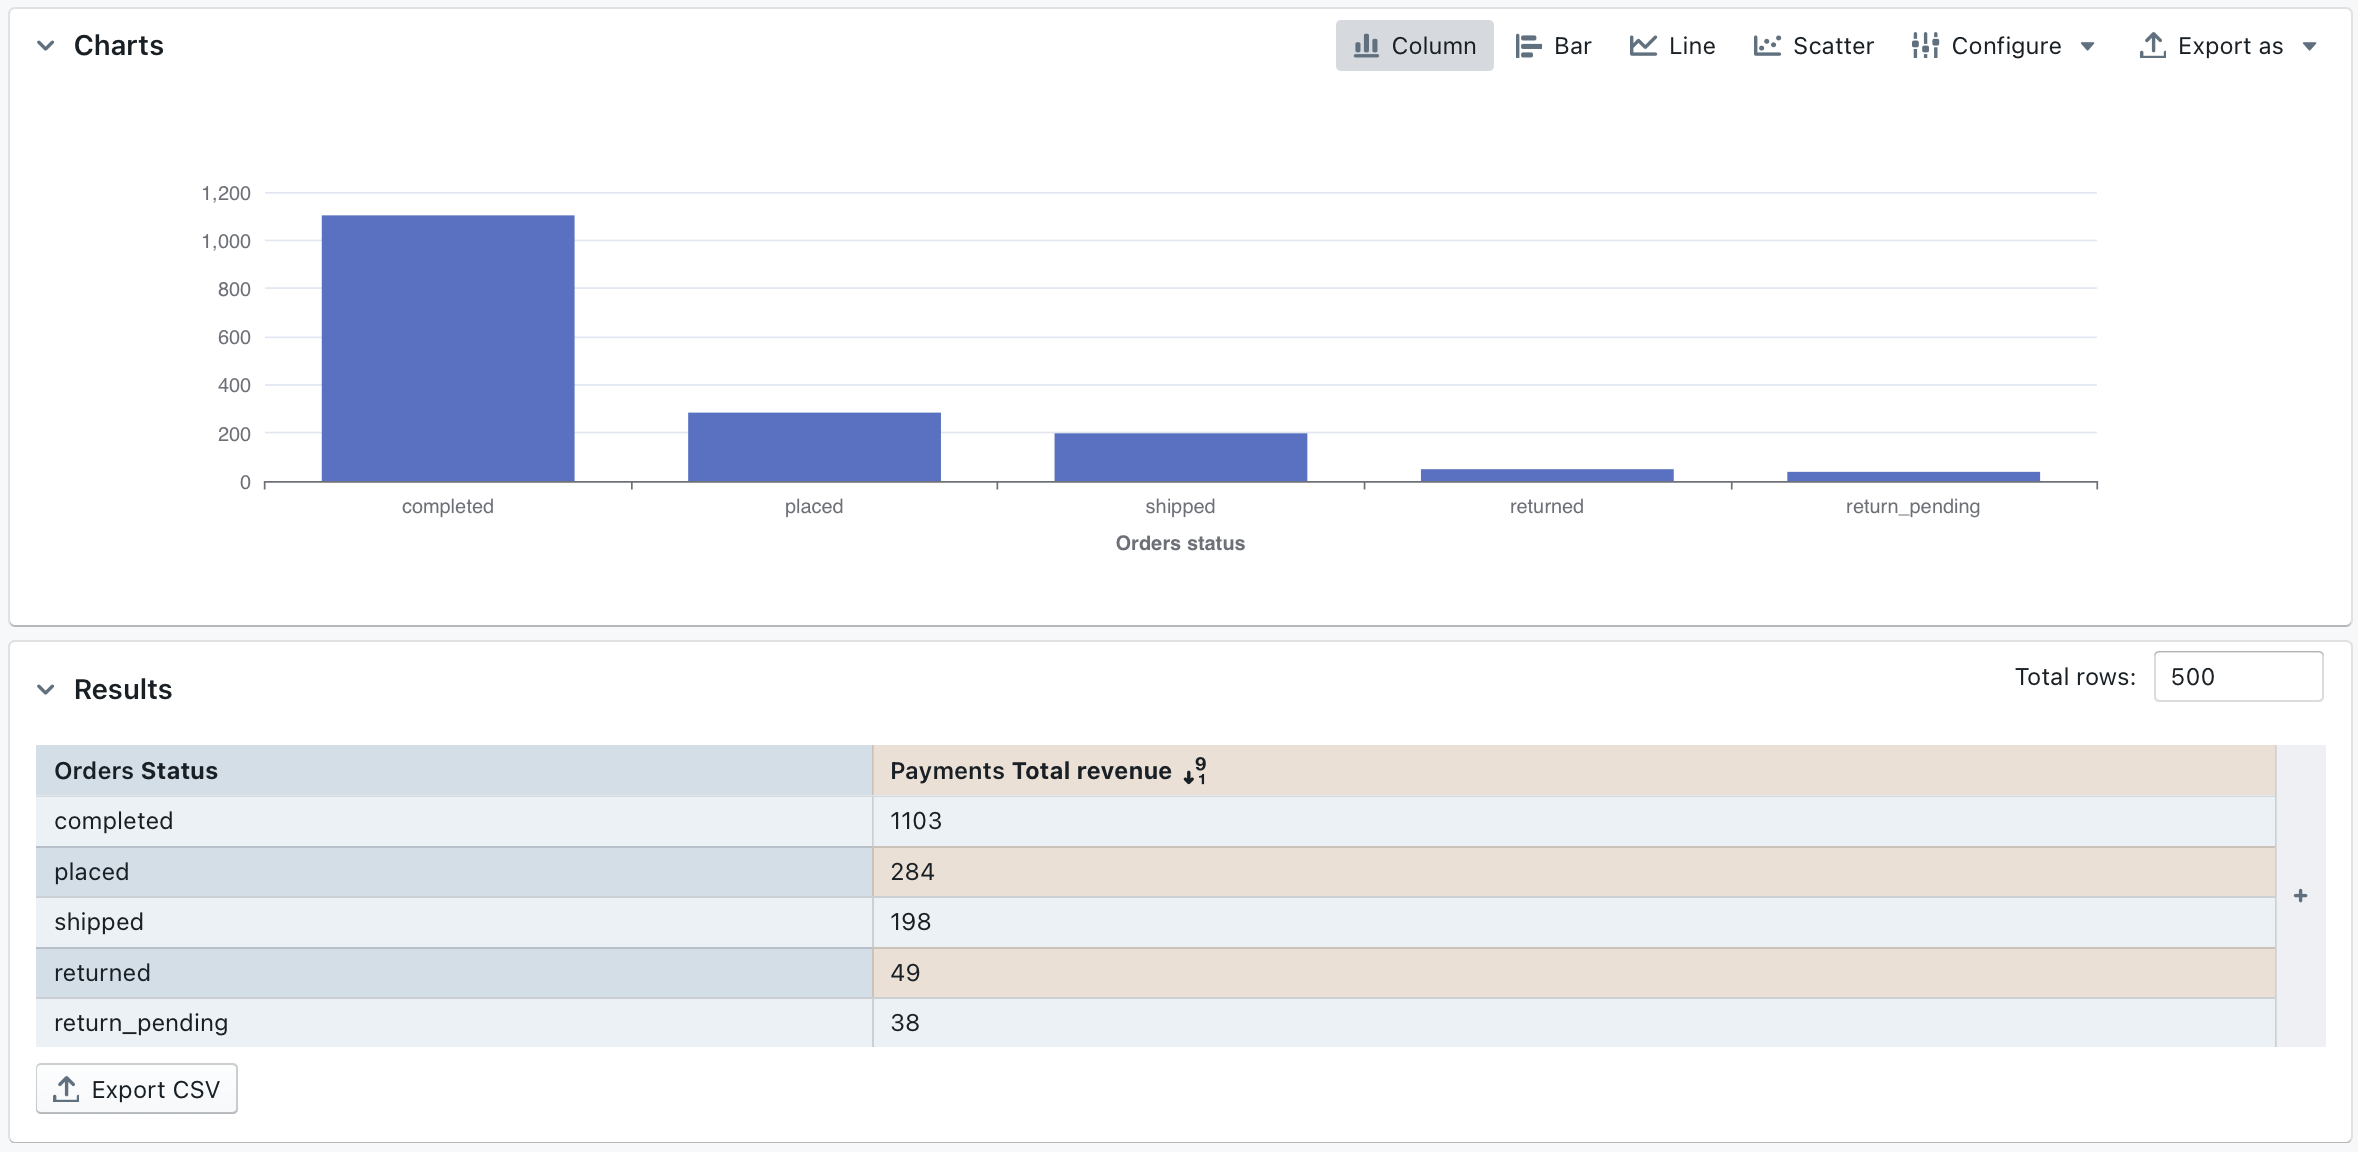
For example, if I wanted to know the "total number of orders split by order status", I'd select the Unique order
count metric to calculate the number of orders and the Status dimension to split that by status.
Visualising query results as a chart
Once the query executes, the results will show in the results table. You can then open the charts section and choose a chart type to visualise the metric.
Saving a chart
Saved Charts allow you to save a specific chart or visualisation so you can share it or revisit it again in future.
When you open a saved charts, it will always update to display the latest data in your database.
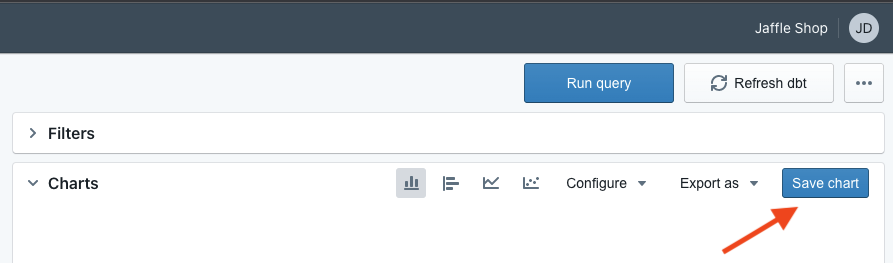
To save a chart:
- In chart panel of the Explore you will find the button to save your chart.
- Enter a memorable name for the chart, a good idea is to use a question as the name "How many orders are there at each stage?"
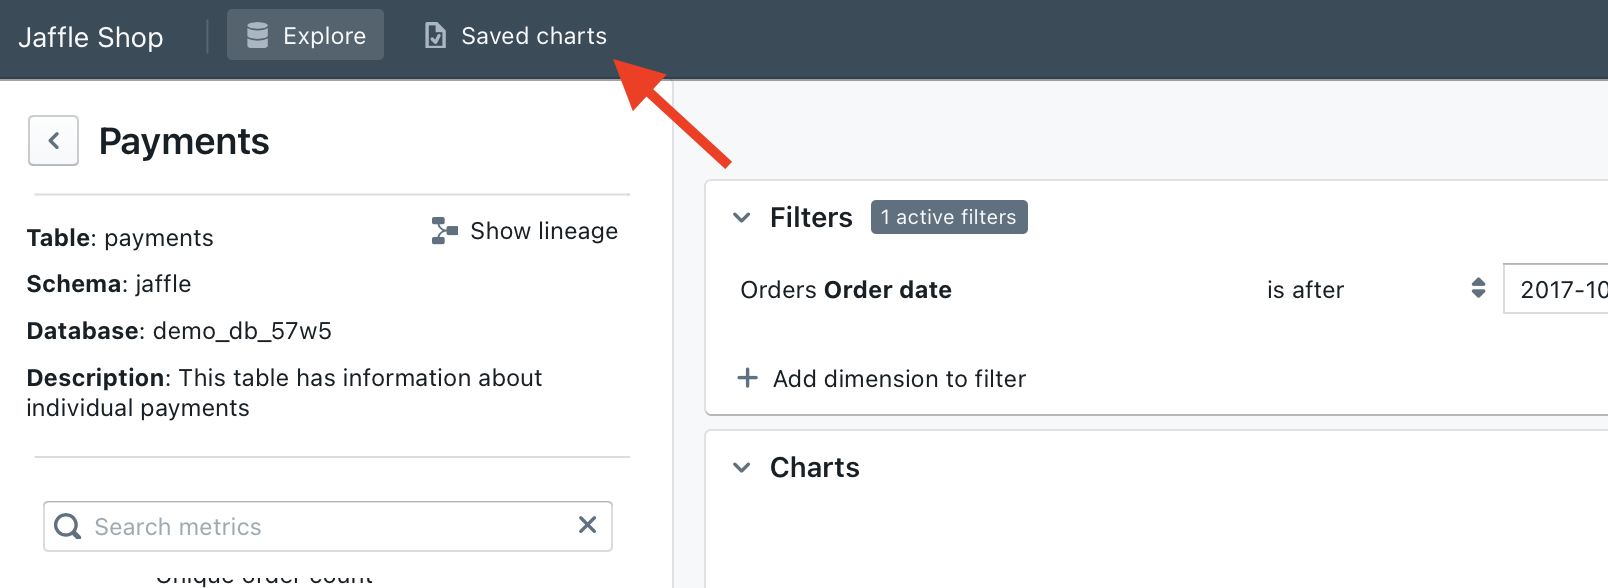
- Click on
Saved chartsto see your finished work of art 😚👌
Next steps
Creating a chart is cool, creating three charts is 3x cooler. Creating a dashboard with your three charts is 300x cooler 😎. Learn how to create and share dashboards