Create your first dimensions and metrics
You must define metrics and dimensions before you can start exploring and visualizing data with Lightdash. Metrics are defined in your dbt project alongside your dbt model properties.
- Dimensions are used to segment data in your models
- Metrics are used to perform calculations on your data models
Example
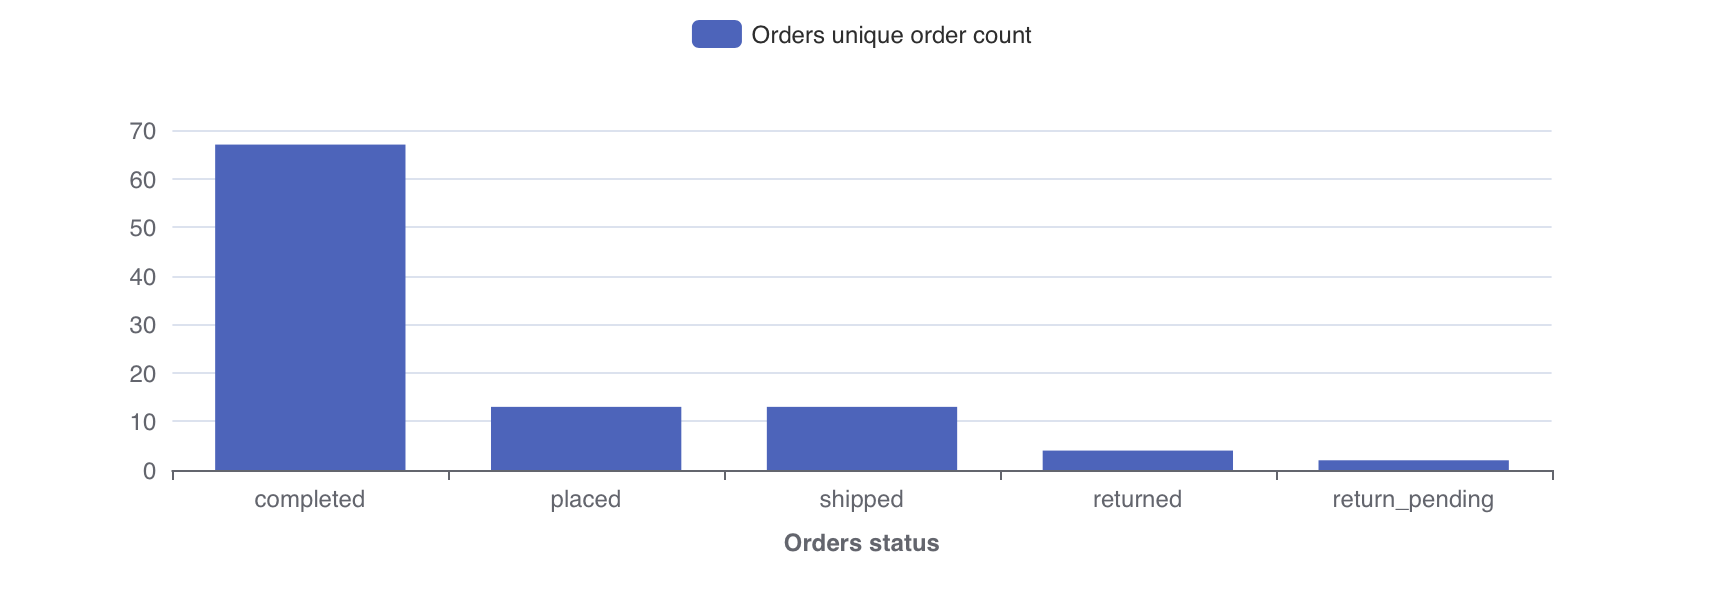
Say we're running an ecommerce business, we probably have a table containing all order data. We might want to ask:
This question can be answered using a single metric "the total number of unique orders" and a single dimension for splitting the metric by "status of order". In Lightdash you'd get the following chart:
To learn more about why we use dimensions and metrics in Lightdash, [read the Lightdash approach to BI](../.. /best-practice/lightdash-way.md)
1. Add a dimension to your project
Dimensions are created automatically when you define columns in your dbt model properties. To define columns add a
new .yml file to your models/ directory in your dbt project.
For example, the following dbt project file contains properties that create a single dimension for the orders model in Lightdash:
version: 2
models:
  - name: orders
    description: "A table of all orders."
    columns:
      - name: status
        description: "Status of an order: ordered/processed/complete"
The name of the dimension is status and the type will be inferred from the column in your database.
:::
info
There are some pretty great tools for automatically generating and updating your model .yml files in dbt. Our favourites are dbt-invoke and dbt-coves.
2. Add a metric to your project
Metrics are defined in your dbt project files along with your dimensions and dbt model properties.
If dimensions segment your data into groups, metrics calculate interesting statistics for those groups.
For example, once we've used the status dimension to split orders by their status, we may want to know the
"Total number of orders" or the "Total sales" of the orders. These calculations are metrics:
# schema.yml
version: 2
models:
  - name: "orders"
    description: "A table of all orders."
    columns:
      - name: "status"
        description: "Status of an order: ordered/processed/complete"
      - name: "order_id"
        meta:
          metrics:
            total_order_count:
              type: count_distinct
      - name: "order_value"
        meta:
          metrics:
            total_sales:
              type: sum
You can see the full list of metric types that you can use in your Lightdash project.
3. Load your metrics + dimensions in Lightdash
Commit the new dbt project files containing your dimensions and metrics to your dbt project:
- Github/Gitlab: commit the files and push them to the branch connected with Lightdash.
- local dbt project: save the new files
Finally hit "Refresh dbt" in the Lightdash UI to load them into Lightdash and start exploring.
Next steps
Now that you've made some shiny new metrics, it's time to start exploring your data!